– The 2022/23 season proved to be an inverse year when the seasonal high came early and the low came later! The range for the year beginning the 1st January 2022 and ending 31st May 2023 and looking at futures months of the same season only (i.e Z23, H, K and N23 only), was an extremely wide one trading between 133.79 and 70.21 being a range of 63.58c/lb. The only inverse year where we have seen a bigger range was the 11/12 season which saw a range of 74.28c/lb!
– EAP were ALWAYS on high alert as to what would happen next in full knowledge that patterns repeat time and time again and the 11/12 season gave us many clues in determining what would happen in the 22/23 season! Making sure one was not whipsawed by moves of such a magnitude was integral to spinner, merchant and retailer alike!
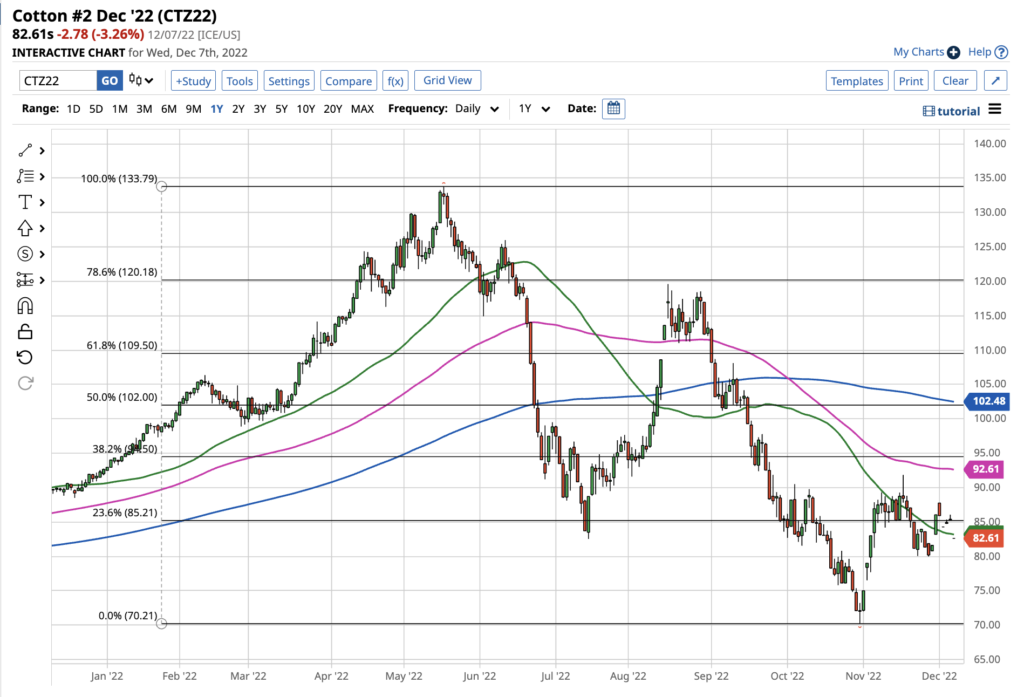
– The high for the 22/23 season was made on the 17th May and the low on the 31st October of the same year. The number of days between the high and low was 167! EAP comments in our report of the 21st May and 4 days after the 133.79 high stated the following “We have included below a chart of Z22 and within it have highlighted the low of the contract just under a year ago at 77.00 in June 2021 to the recent high of 133.79 seen last week. Prices remain far above the longer term 100 and 200 day moving averages. Contract highs and lows are most popular in May and March months of the year on an historical basis and we maintain our belief that in a few months time one will look back at this time and find that prices will prove to have been fully valued at current levels. Time will tell if we are proven to be correct or otherwise!”
– Noting that the most likely month for a high since 1960 is May it should not have been a surprise we saw our high in May AGAIN! May highs have occurred 21 times out of 63 years of data compiled since 1960, or 1/3rd of the time when odds dictate they should only occur just over 5 or 6 times only.
– Back on the 3rd September in our weekend report we stated “Below is a Cotton continuation chart dating back to 1970. The high to low this century is 28.20 to 227.00. Emotions run high when we see moves in Cotton as we have witnessed over the last 12 months but a look at the chart below is a factual reminder that despite everything Cotton will revert back to its “mean” and prices in the 100’s are seldom seen for extended periods. Few people agree with EAP on the suggestion we will be back below 80c by seasons end but it is what our work suggests and what our computer model predicts!”
– The low occurred on the 31st October and in our conclusion of our report of 12th November 2022 we stated “the cotton market has found resistance this week just under 90c/lb basis Z22 and 87.15 basis H23. We maintain that for H23 we see prices in the mid to high 80’s as fully valued and any move for this contract into the 90’s as an outright selling opportunity. Our bearish stance is based upon a lack of demand which will eventually be addressed by continued monthly WASDE reductions to world consumption. We would not want to be short Cotton long term under 70c/lb but feel a sideways market is likely for the rest of the 22/23 season!”
– The above statement made 7 months before seasons end proved insightful and a relative period of calm followed months of extreme volatility!
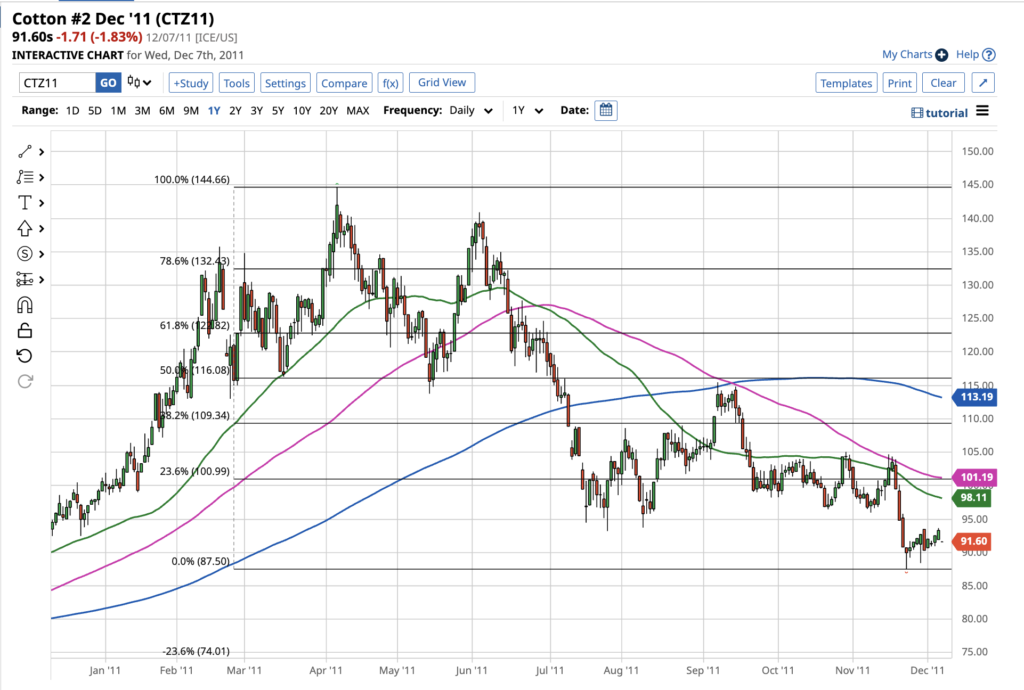
– The charts of Z22 and Z11 bear many similarities not only in their wide range and seasonal highs but the 40-50c/lb drops from highs in May/June into the end of July, subsequent 20 to 30c/lb bounces into late September and drops to lows again in late October!
– It proved a very good year for EAP’s forecasting and we put it down to hard work based on Fundamentals, Statistics, Money (reading hedge funds), Technicals and last but by no means least Macro factors. All of these 5 factors have a part to play for any commodity as they will for the season ahead!
– The most important futures month in any Cotton season for EAP is always December, simply because we like to look at a 17 month season noting December is the front month for 10 of the 17 months, on account of holding the highest open interest.
– Above are the charts of December 2022, as well as the one for 2011. That year was the most volatile December that was an inverse season and in turn had much to offer as to what might happen in the 22/23 season. In truth the Z22 chart incorporated the whole range for the season until it rolled to March at the end of October when March became the front month on account of holding the highest open interest.
– This last point is fascinating for the fact that by the 1st November 2022 there were still 7 months to go of our 17 month season and those last 7 months proved to be confined to a very tight 15c/lb range in comparison to the rest of the year.
– Indeed it was a great opportunity to take advantage of the high volatility of options. The cost of insuring against adverse moves was expensive but if one was of the opinion we would drift sideways for months then, big money could be made by selling that insurance to others for large premiums! This we suggested to do continually over the period between November and the end of March and was taken advantage of by many of our bigger clients!
– Our study of previous similar seasons allows us to have a higher degree of confidence than we might have otherwise have felt as we have long learnt to use our statistical advantage and experience of the Cotton market over literally decades to seek a competitive advantage!
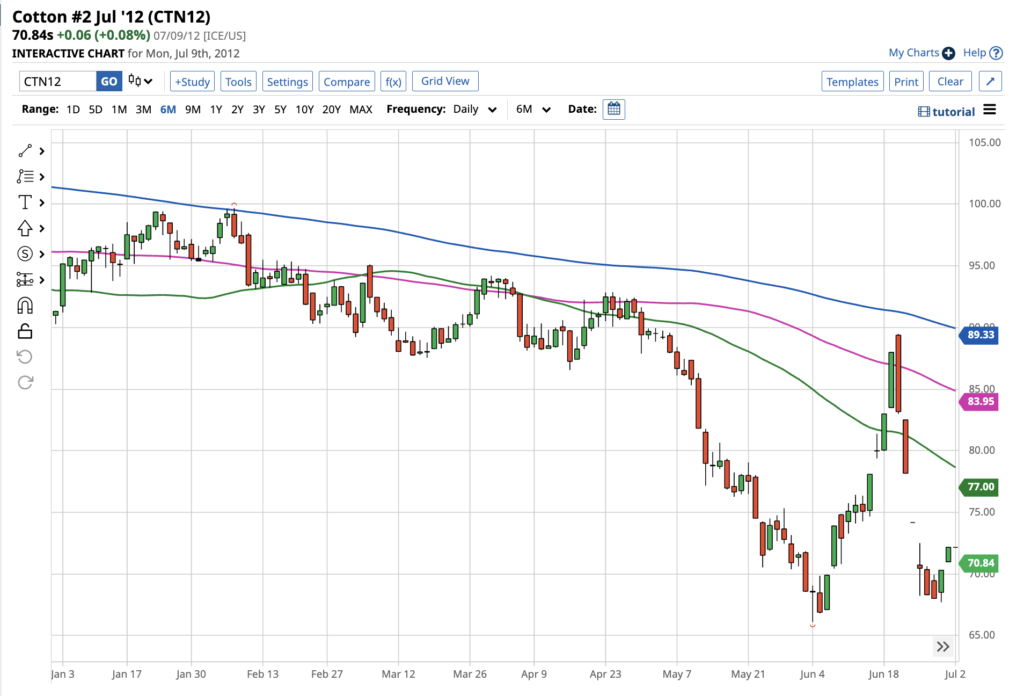
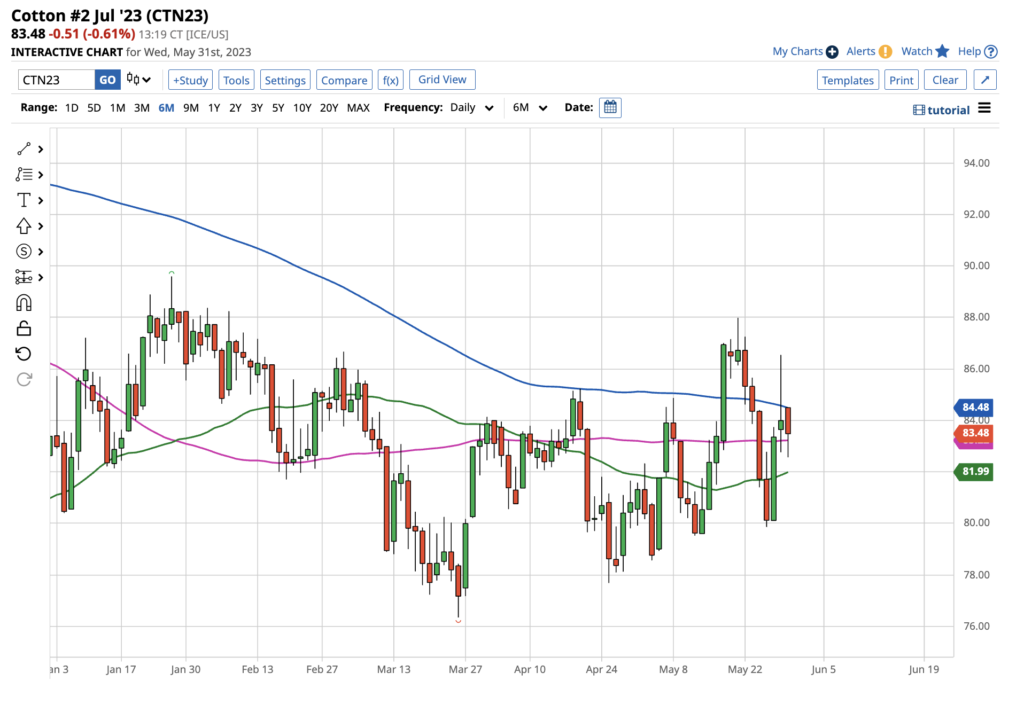
– EAP highlighted the similarities of the N12 season to the N23 season many many times as the the last 1/4 of 2022 played out and enclose the charts of both for reminder purposes.
– Whilst the last two weeks of May 23 for N23 did not play out as N12 did, which collapsed, the season was largely done and we have long stated we prefer to avoid July expiries because of the extreme volatility which usually occurs in the roll from old crop to new crop!
Conclusion
– The 22/23 season has been one of the most volatile of this century so far but prices are now nearly back to near their mean.
– The 23/24 season is upon us and EAP believe that another inverse season is likely and will be commenting in our bi-weekly reports as to what we see influencing the market in the weeks and months ahead noting that based upon our 17 month season we are already 5 months in!
We are diligently working to constantly improve your experience on our website. If you would like to provide us with any feedback, please click the button below.