- Chris Williams
- October 10, 2022
- 2:11 pm
– We are now well into the 2022/23 season and the harvest is imminent in the Northern Hemisphere. Whilst conditions will of course change over time, we believe that now is a good time to take a deep dive into our Supply and Demand numbers for the season and how we view their impact on market direction.
– NB – for purposes of consistency we will refer to US statistical bales throughout, where SnDs are commonly discussed in other measures, for instance local weight bales, we will reference in parenthesis
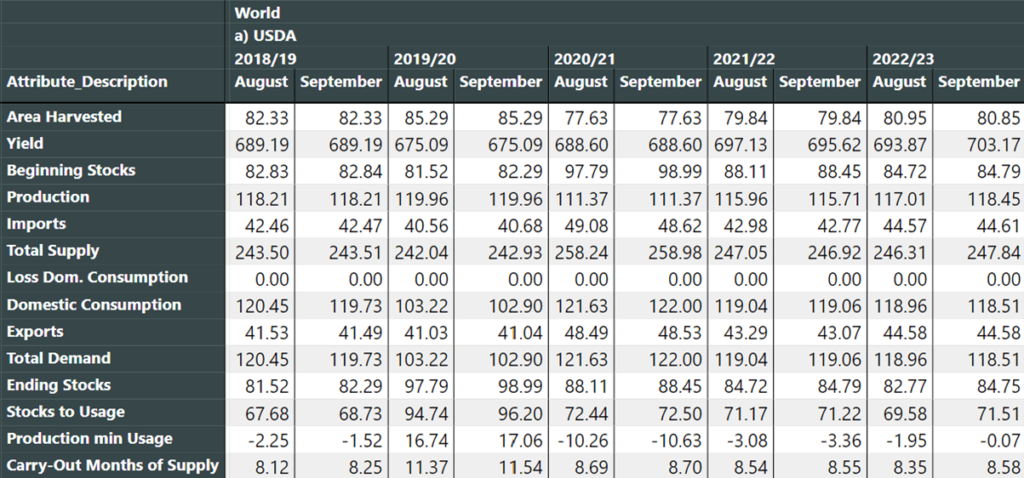
– The USDA released their latest WASDE on 12th September and the world figures are below (courtesy of our friends at IAG). The October WASDE will be released this coming Wednesday, 12th October.
China
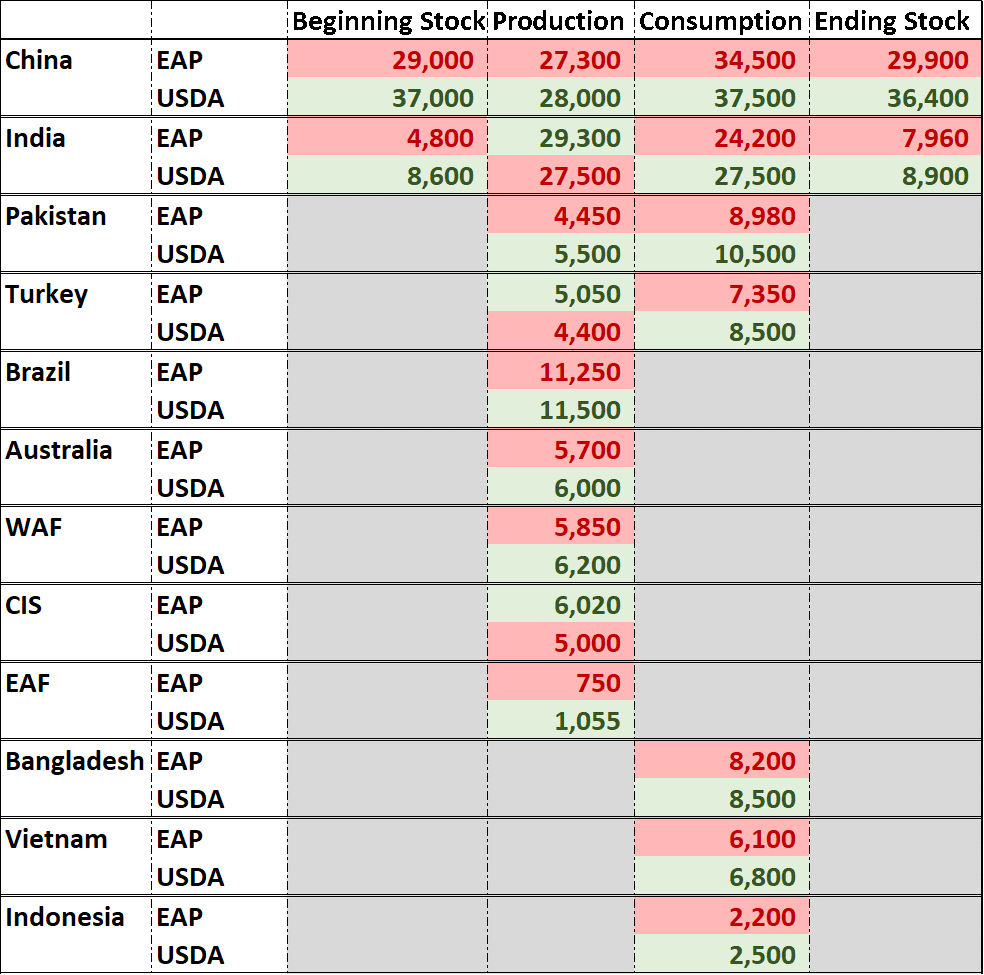
– We continue to see historical stock differences with the USDA. EAP beginning stocks stand at 29 million bales compared to 37 million bales for the USDA. This difference narrows to 29.9 million bales and 36.4 million bales respectively over the course of the year, but we believe this is down to an overestimation of consumption on the part of USDA (see below).
– We are pretty much aligned with USDA at this point on production, either side of 27.5 million bales.
– With regards to consumption, we continue to differ markedly from the USDA. Our estimate of consumption is 34.5 million bales, compared to 37.5 million for USDA (this will become a theme of this report).
– Government reserve stocks are estimated to be 10.6 million bales, with “free” ending stocks shrinking to 19.3 million bales, this is the lowest since 17/18 and in the interim free ending stocks have remained remarkably steady between 20 and 20.7 million bales – the caveat of course, is there is a high probability that Reserve actions over the course of the season will change this outcome.
India
– As with China, we have historical differences on stocks with the USDA: our beginning stocks stand at 4.8 million bales (6.195 million local), against 8.6 million for the USDA (11.065 million local). If we move to an Indian marketing year (beginning 1st October), the CAI has beginning stocks of 2.8 million Indian weight bales, when converted forward EAP’s beginning stock number becomes 2.66 million local weight bales and the USDA 7.5 million. In fact, reliable friends on the ground would tell us that even our own number is too high. We certainly lean this way, but for now, find that circle hard to statistically square.
– On production all reports we are hearing so far are positive and we have a production figure of 29.28 million stat bales (37.5 million local), we are perhaps to the high end of estimates and in recent years Indian crops have struggled with yield as the season has gone on, but for now we are comfortable in our number. On the other hand, the USDA stand at 27.5 million bales (35.2 million). For our numbers to converge to the downside we would have to see yields worsen from this stage with little or no change on the USDA side.
– Once again, the EAP consumption number is below USDA, and at the current pace of production our bias would be to the downside. EAP have consumption at 24.2 million bales (31 million), against 25 million bales for the USDA (32 million).
– EAP have a build in ending stocks to 7 million bales (8.95 million local), whilst USDA remain relatively stable, though both of these numbers are based on conservative export numbers that may move upwards.
Pakistan
– When it comes to Pakistan production we must give the benefit of the doubt to USDA, the current WASDE figures likely do not take into account the full extent of the damage caused by the recent flooding. USDA stands at 5.5 million bales (7 million local), compared to EAP at 4.45 million bales (5.7 million).
– Whilst consumption may well be affected by the disruption of the flooding this will likely be relatively minor in comparison to the changes to production and the far greater impact will come from the overall spinning and demand economics. With this in mind EAP have Pakistan consumption at 8.9 million bales (11.5 million) significantly lower than the USDA’s 10.5 million bales (13.5 million).
Turkey
– Once again, we may wish to give the USDA the benefit of the doubt with regards to the timing of the WASDE, recent reports from good friends in Turkey place the crop a shade over 5 million bales, whilst USDA are currently a 4.4 million bales However, we may see some movement here in the upcoming October WASDE.
– On consumption we are once again markedly below USDA where our 7.35 million bales compares to 8.5 million bales.
– The above points mean we also have exports at 920,000 bales (upward bias) against 650,000 bales and our imports are 3.675 million bales (the lowest since 18/19), compared to 4.8 million bales for USDA.
Producers
– Brazil’s numbers distort the USDA figures as the harvest straddles US crop years. To get around this the USDA count the entirety of the crop in the outgoing crop year, for instance the crop that has just been harvested in 2022 is recorded in the 2021/22 crop estimates. This is quite distorting as, whilst the harvest begins in the 2021/22 crop year, most of the cotton for export will in fact be shipped in the 2022/23 crop year.
– So, with this in mind, our best comparison to USDA production numbers right now is the 2022 harvest, recorded by USDA as 2021/22 (NB in our global comparison below we will stick to USDA methodology for consistency). Here we are broadly in line with USDA with our crop estimate at 11.25 million bales, just 250,000 bales below USDA.
– In USA, following last month’s increase in production estimate, we now find ourselves below the USDA with 13.1 million bales playing 13.8 million.
– Australia is looking at its largest crop in a number of years and we are slightly below USDA with 5.7 million bales vs. their 6 million bales.
– In West Africa, we find ourselves perhaps on the high side of many trade estimates with 5.85 million bales, whilst the USDA is higher still with 6.2 million bales.
– Our production exceeds USDA in Central Asia by 1 million bales: 6 million bales to 5 million bales. This is quite some distance but, given the recent, confusing alterations to Uzbek consumption by USDA we will rely on our friends in the region!!!
Consumers
– In Bangladesh, we are reluctantly close to the USDA numbers, 8.2 million bales for us and 8.5 million bales for USDA. However, this is based on the pace of import shipments and, given recent reports from mills in the country, our bias is strongly to the downside.
– In Vietnam, however, we feel the USDA are not taking into account the sharply declining arrivals and are overestimating considerably at 6.8 million bales. Our own estimate is 6.1 million bales and, once again, our bias is to the downside.
Global
– For the 2022/23 season we have significantly lower consumption than USDA with our global total at 110,800 million bales, compared to 118,600 bales for the USDA. Production wise EAP are marginally above USDA with 118,800 million bales compared to 118,400 million bales for USDA.
– Due to our historical differences in India and China our ending stocks are lower, but this has been true for some time now and, we also believe this is outweighed by the significant seasonal slowdown in consumption prior to new the new crop harvest when tight stocks are usually most felt.
– Most importantly, we believe, is the direction of travel as can be seen in the below table:
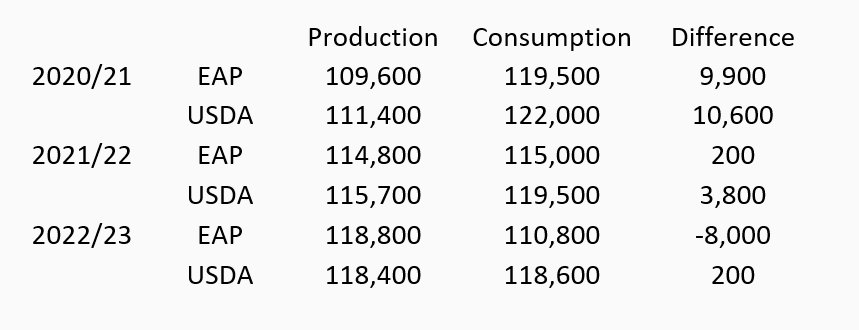
– The USDA have two years of consumption outstripping production, which then levels off this year. For ourselves, we believe the bull market was fuelled by excess consumption of 2020/21, this situation persisted into early 2021/22 at which point the consumption outlook changed, and our market view with it!! Since then we have seen a generally weakening market and we believe this will continue throughout the course of this season as production significantly exceeds consumption, irrespective of the issues with the US crop!!