
New Special Study
Reasons why Cotton may have just seen a seasonal high for the 22/23 season and what to expect next?

- Jo Earlam
- June 14, 2022
- 3:31 pm
Technicals
– Firstly we have looked at the low/high for Cotton this century which was 28.20 on the 26th October 2001 and a high of 227.00 on 7th March 2011. This is detailed in the below 25 year cotton continuation chart where the 68.2% Fib retrace of this move lies at 151.06. We have only ever had 1 close above this level in the 21/22 season and of the 4 closes in the 150’s all have occurred in May 22 and we are yet to have a weekly or monthly close in the 150’s. Weekly, monthly and yearly closes are always important levels to consider!
– These are the highest prices seen in 11 years but the percentage move from low to high in 21/22 is 101.2% which not particularly extraordinary, ranking 5th highest percentage move out of 22 completed seasons this century.


Statistics
– Statistically May, March and June are the most likely months to have seasonal highs, in that order. These months alone account for more than half the last 62 years of seasonal highs assuming a 17 month season that runs from the 1st January each calendar year through to the 31st May the following calendar year, but only looking at futures months of the same season i.e. Z, H, K and N only.
– The average seasonal 17 month range this century is 40 c/lb but in percentage terms it moves 75% every season. Since 1960 the percentage movement for the price of cotton in a season has only ever been in the 100’s five times before the 2021/22 season. The first time this happened since 1960 was in the 1986/87 season.
– If we take the anomaly of the 2010/11 season out from those five times (where it moved 220.5%), then the following year has moved an average of 65.375%. Interestingly, when we look at the average percentage move in price since that 1986/87 year, it is 65%, meaning that after a move above 100%, the following season tends to return to the average price movement which we believe is what to expect in the 22/23 season.
– The current bull market began on the 1st April 2020 when Cotton bottomed basis the May contract at 48.35 and topped out basis the July contract at 155.95 on Wednesday 4th May 2022. Fibonacci works not just in price but in time as well and noting our point made in our market report of the 6th May of this year.
– “The bull run began back on the 1st April 2020 and there have been an exact Fibonacci 764 days that coincided with the high of 155.95 seen on Wednesday before seeing a sustained sell off that is the strongest downward move seen since this bull market began.”
– Here is a chart of Cotton of December Cotton over the last 6 months. Note how it has been respecting key Fibonacci levels.

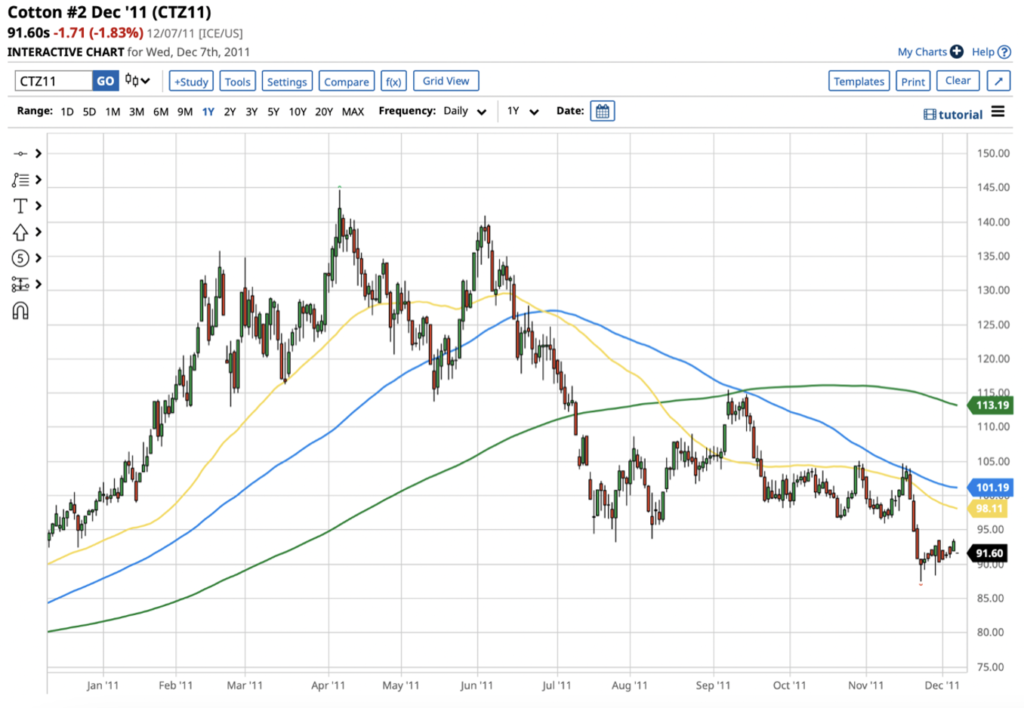
– Below are the two charts of Z11 and Z22 from the 1st of the calendar year to the 13th June. Both saw moves that started under 100c/lb in their respective calendar years, with Z11 nearly reaching 145c/lb (the highest level ever for any December contract in modern history when it traded at 144.66 on 6th April 2011), whilst Z22 traded at 133.79 on the 17th May.


– We suggest that for Cotton to move much higher than the 150’s will require not only a weekly but monthly close as well and moreover we do not believe it will be anytime soon! Indeed noting Z11 eventually finished at its lows of the season at expiry we wonder if Z22 is about to do the same! Here is the final chart of Z11.
Fundamentals
– One of the reasons we are on high alert for a seasonal high in Z22 too is because of the massive run Z22 has been on for weeks and because in 2011 the high was on the 2nd June in the midst of an almost identical Texas drought to the one we are facing today! On that occasion the market fell 33% over a 6 week period from 140 to 95c/lb! The equivalent fall would be like Z22 going to 86c/lb from its high just below 130c/lb. We do not expect this scale of fall but if the funds start selling out of Corn, Soy and Cotton a swift move to 100c/lb would not be out of the question for Z22!
– We would add that Cotton topped first before its big brothers in 2011 and was trading near its lows by mid July whilst it took until end of August 2011 for the highs to be completed in 2011 when they also fell by circa 25% by the 1st week of October.
– This century, the average global area harvested for cotton has been 32,910 (1000 HA) and in 2022 the estimate is 32,931 or almost exactly the average. 2022 is an increase on 2021 and even looking as far back as 1960 there have never been 3 consecutive years that show an increase. This could possibly be due to more and more farmers jumping on to the rising cotton price train over years 0 & 1, which of course increases the land dedicated to cotton, this in turn produces more available cotton only to have prices fall due to the then over supply at the end of year 2. This naturally then pushes the farmers into more profitable commodities and the land dedicated to cotton falls once again. This is a natural cycle which repeats over and over throughout history.
– This is backed up by the fact that in all of the 18 occasions (bar 1, 1970) that gave us a 2nd consecutive year of increased land harvested, the same or following season gave us an inverse year. So, if we follow history, as 2021/22 was not inverse does that tell us 2022/23 must be?
– Since the beginning of this century, world population has risen by an estimated almost 2bn people. This has lent itself to a 1.5% rise in global consumption over the same period which is below the production average of 1.9%. This naturally has created an increase in reserves of an extra 32m bales globally, taking the 2022 estimated global closing stock to 83m bales. Again, this tells us that as production outweighs consumption then the over-supply would encourage falling prices.
– Looking at the recent numbers a little more closely, the world stocks have fallen in each of the last 3 consecutive years. There has only ever been 1 single occasion (1989) where the 4th year has also seen a fall. So, if we are to follow history, we would expect a rise in world closing stocks in 2023. All but one (1970) of the following rising years have been inverse, where our seasonal high comes before our seasonal low.
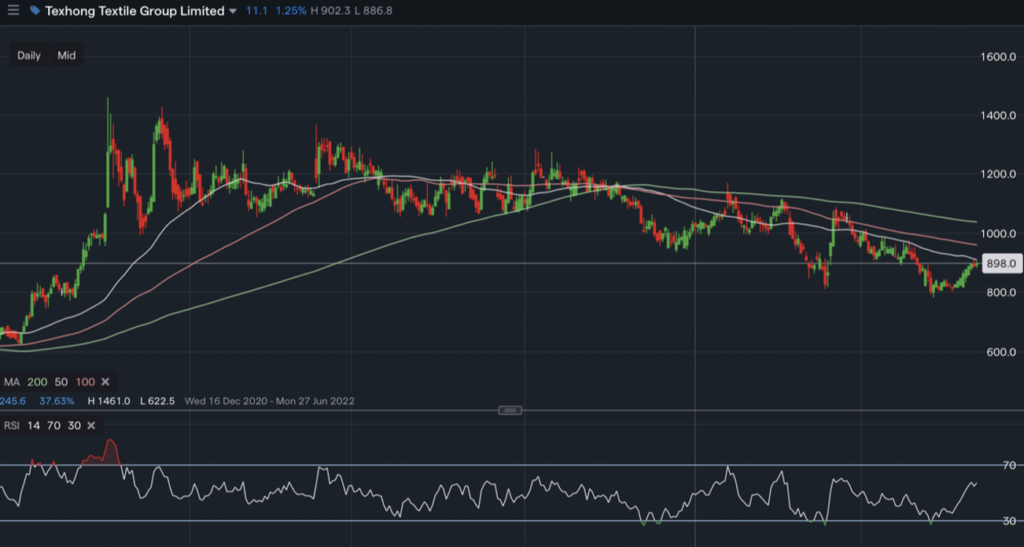
– Our two companies of Weiqao and Texhong are confirmation that shares of spinning companies are under pressure. In other words the current very high Cotton price makes little sense when it comes to making a profit when turning raw cotton into yarn. Turkish yarn stocks are extremely high despite there being very little cotton available.

– It is also worth pointing out the severity of the situation on the demand side of things. With US CPI just announced at 8.6%, consumers are being hit hard by rising prices and some are struggling to buy the essentials like fuel and food. The US saving rate has dropped to 4.4% recently, its lowest level since 2008, which just highlights the fact that everyday people don’t have the disposable cash to be buying clothes in this current economic climate and the large retailers are already feeling the effects of this. Target are taking a short term hit to profits as they reduce prices and cancel orders to try and shrink their inventory. With the way that interest rates are going, this situation is more than likely going to worsen before it improves.
– This last week we have seen a ‘sea of red’ across the crypto space with Bitcoin down over 23% and Ethereum down over 30% over the last 7 days, both hitting 18 month lows. During the pandemic, many people had spare cash from things like government loans and furlough schemes, as well as the fact that they couldn’t go out and spend their income as they usually would. When you couple this with the fact that at the time, cryptocurrencies were rallying in a strong bull market, it drew many people in to investing in the crypto sector, whether that was through ETFs or buying things like Bitcoin themselves. This recent crash has meant that people have had to decide whether to try and ride it out with the hope that things will improve further down the line, or with withdraw their funds and realise their losses. Both options have the same or very similar result, consumers have less money to spend on non essentials!
– We like to look at cottons ‘big brothers’ for a more in-depth analysis of where prices could be going. New crop soybeans hit new highs as of 9th June reaching $15.85 / bushel with demand for soybean oil driving prices higher as China begins to ease its lockdowns and restaurants open. Whether the high is in for soy is unknown, but US plantings are now back to the 5 year average for this point in the year, and Brazil is looking at an increase of 2.92% in area planted. So for now, supply concerns are limited.
– December corn looks to have peaked in mid May with concerns over new crop plantings but with the funds cutting their long position by almost 50,000 contracts in recent week, new highs look unlikely. Then we have December wheat which has faced a volatile time with the conflict in Ukraine. Prices were driven sky high with fears over the crop condition and harvest, never mind exporting on top of that, which is looking unlikely at the moment. However, talks are underway between Turkey and Russia regarding allowing Black Sea exports of grains, if exports were to commence, prices will almost certainly come rattling off.


Conclusion
– With the three of them looking like they could have topped out, with the possibility that soy could have slightly further to go, this would support the fact that we think December cotton has seen its highs, as ‘all boats move with the tide’.