

All markets surge as rumours of China's zero Covid policy is to end!
Markets reflect the economic and geopolitical landscapes, which remain highly divisive and volatile. Liquidity in markets across all asset classes has declined, which is a prescription for high price variance.
CTZ22 – 86.93 (+3.93)
CTH23 – 85.67 (+3.50)
CTK23 – 84.63 (+2.63)
CTN23 – 83.26 (+2.10)
CTZ23 – 78.37 (+1.11)
Zhengzhou WQF23 – 13,435 (+355)
Cotlook “A” Index – 100.10 (+3.90)
Daily volume – 89,204
AWP – 65.46
Open interest – 255,293
Certificated stock – 880
Z22/H23 spread – (+1.26)
Z22/Z23 spread – (+8.56)
December Options Expiry – 11th November 2022
December 1st Notice Day – 23rd November 2022
– Cotton made a bottom on Monday, but subsequently lead all the softs in a rampant bullish move that has taken it to its highest price in nearly a month.
– Last week was one the most volatile weeks of the season, having traded in a huge 17.66 c/lb range between 70.21 (the seasonal low so far) and 87.87, before closing the week up 1482 points at 86.93.
– Volume increased hugely as the week wore on averaging 64,498 contracts, as the roll from Z22 to H23 continues. On Monday we have the start of the GSCI roll period which lasts for 5 consecutive days. We can be sure that by Tuesday of next week H23 will be the front month on account of having the highest open interest.
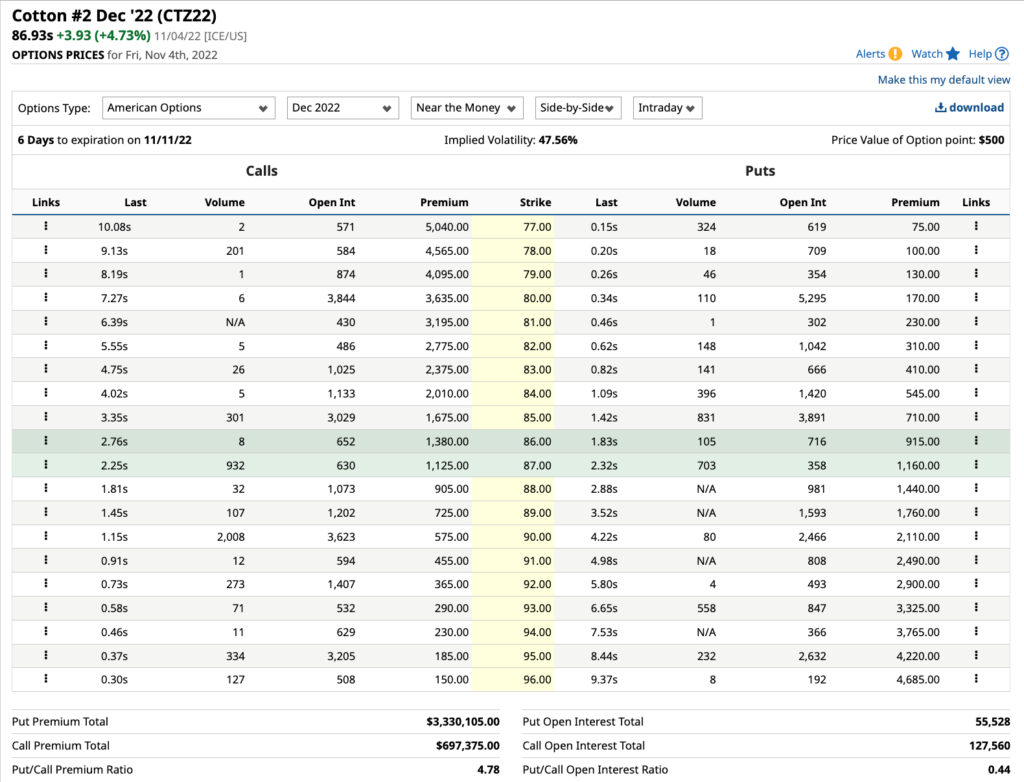
– Next week is sure to remain volatile with many of the cotton trade travelling to the annual ICA conference in Las Vegas, USA, the September WASDE on Wednesday and Z22 option expiry on Friday! One would be quite right to say 21/22 was a volatile year with an average weekly range of 762 points but so far for 22/23 it is even higher at 977 points. It is perhaps no wonder that implied “at the money” option volatility remains high at over 47.56%.
– It is always worth taking a look at the open interest in options a week before expiry to try to determine where Z23 could expire next Friday, noting that the strike price where most of the open interest is has a habit of seeing the futures price close at or near to! Looking at the below picture of nearby options, there is a lot of interest at both the 85 and 90 strikes but most is at the 80 strike and a close there next Friday would cause most pain for holders of options! The full list can be seen by clicking on the link at the bottom of this mail!
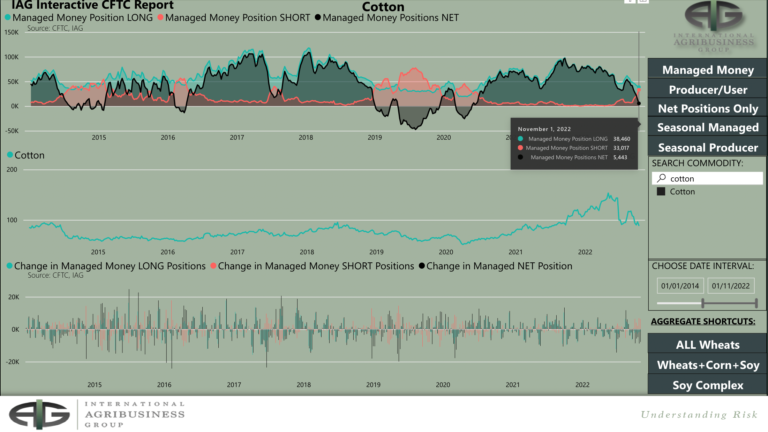
– The CFTC COT report showed Managed Money (MM) to have been heavy net sellers of 7,836 contracts in the week ending last Tuesday, taking their net long to almost flat at 5,440 contracts net long! Between MM, Other (OR) and Non Reportables (NR) their overall net long is now down to 8,179 contracts.
– Prices bottomed on Monday and Tuesday and I think it would be fair to suggest that in the last 3 days of the week we will discover that the price action caused many of the new shorts to have covered and will show up as big buying in next week’s report. On Friday futures volume was nearly 90k contracts so those that had to get out probably did!
– We stated in last week’s report that we felt 68-70c/lb would find good support but we have to admit that we were not expecting a near 17c/lb rise in a week from the 70.21 seasonal low seen on Monday.
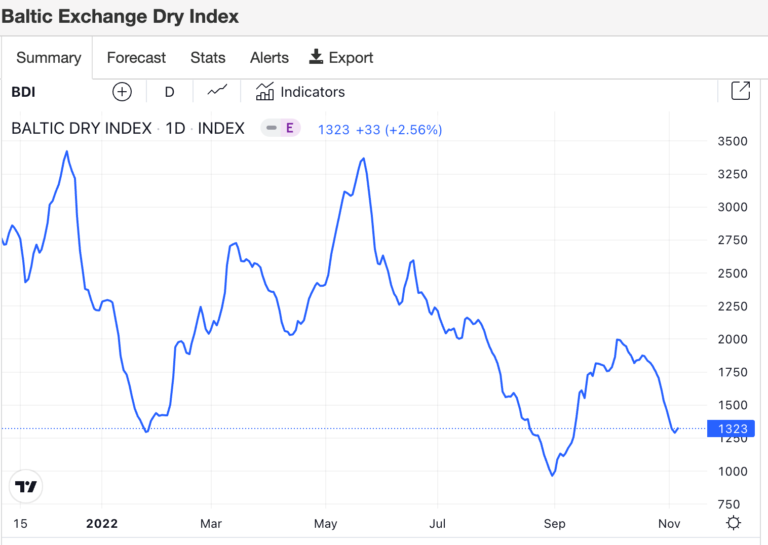
– Cotton was the lead soft commodity in heading higher with a more than 20% gain in a week but gains were also seen for its big brothers of Soy, Corn and Wheat. Copper, Oil and Silver in particular also saw strong gains! On the other hand the Baltic dry index was hit hard and an excellent indicator that we can expect freights to continue to drop in the weeks and months ahead!
– When markets surprise you, efforts to determine what to anticipate next often requires some technical analysis and this time is no different. These surprises happened several times in the last 6 months but each time it proved to be just an extension of the highly volatile range that was being experienced and we maintain this current move will historically prove to be the same. In other words we do not think we are about to head back into the 100’s!
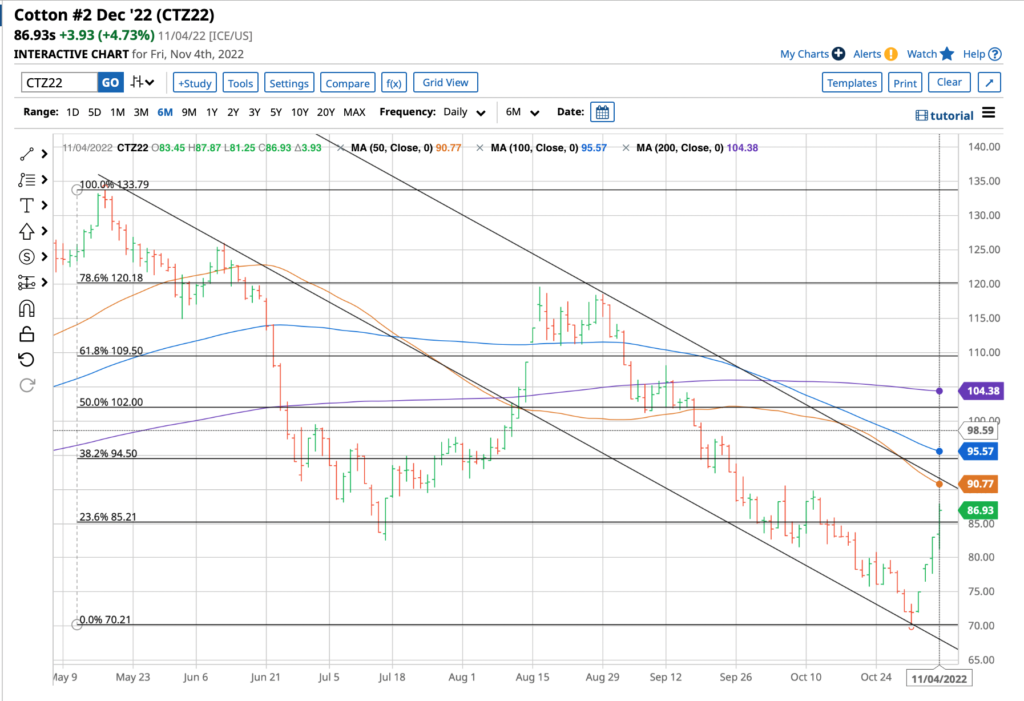
– The seasonal high to low so far is 133.79 to 70.21 being a move of 63.58c/lb with just over half the season gone and assuming a 17month season beginning 1st January 2022 and ending 31st May 2023 and looking only at futures months of the same season being Z22, H, K and N23 only.
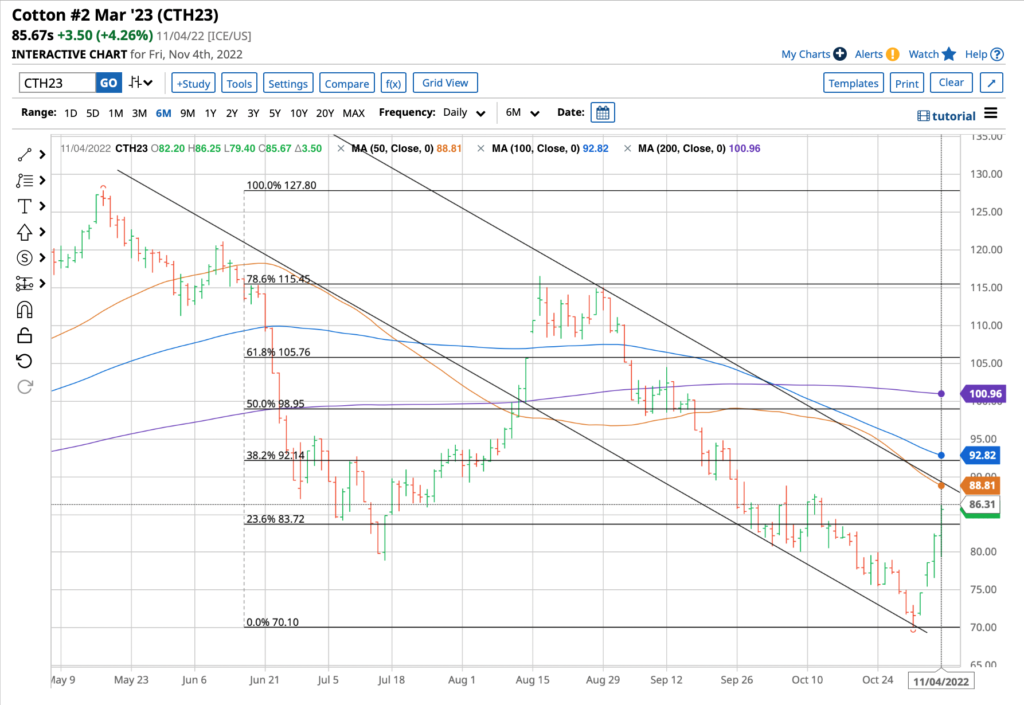
– Charts of Z22 and what is soon to be the front month H23 are enclosed below. Looking at Z22 one cannot rule out a test of 94.50 (38.2% retrace of the Z23 seasonal move) although EAP believe 90c/lb will prove tough resistance. For H23, the 50 and 100 day moving averages at 88.81 and 92.82 will offer resistance as will the 38.2% retrace of the H23 chart seasonal move so far at 92.14!
– Statistically we remain of the opinion our 22/23 season will be an inverse season where highs are seen early in the season and lows later in the season.
– We have been asked so many times this week whether 70.21 is the seasonal low and our answer is we do not think so! We are also quite sure we are in a minority with this viewpoint and certainly not for the 1st time.
– October seasonal lows have occurred 6 times in the past 62 seasons excluding this season and is the 4th most occurring month. If physical Cotton demand is the key to determining the answer, then we would argue that new seasonal lows are likely!
– The spinner situation in Turkey, Bangladesh and Vietnam remains dire with Turkey probably the worst of the aforementioned markets with the main spinner there still operating at 0% repeat 0% capacity! Yarn stocks are simply not selling or if they are, it is at a trickle!
– India has seen prices rise by about 5c against a 15c rise for New York in the last 2/3 weeks. Spinning capacity in India has improved a little over the last 3 weeks and is probably fair to state they are at 70-75% from 50% just 2/3 weeks ago.
– However, we are reminded by reliable friends there, that the spinner is losing 10% on the current price he can procure cotton at. The forward price of Indian cotton into Bangladesh at about 1600-1800 on H23 for 1-23 shipment loses money. Bangladesh is also only operating at 70-75% capacity at best. Either the Indian basis is too high or NY overvalued. We actually think it is a bit of both!
– Noting all the big consuming markets are holding at least 4-6 weeks of heavily loss making yarn stocks. Spinners cannot make money at the current prices which will result in further demand destruction were prices to move even higher.
– However, an adjustment is required to our conclusion following last week’s price action, noting we have previously advised we anticipated a 66 to 86c/lb rest of season range. A lack of liquidity and outright uncertainty in all markets is what we are dealing with today which requires an attitude of “expect the unexpected” and big moves on often small volume.
EAP believe that further rallies, were we to see them, will fail in the early to mid 90’s and scale down fixations from the mid 70’s down to mid 60’s will be buying zones in what will eventually prove to be a more sideways market for the rest of the 22/23 season. We would not want to be short Cotton long term under 70c/lb!
*Please note that we only share CFTC CTO on weekend reports.

No image or information display on this site may be reproduced, transmitted or copied (other than for the purposes of fair dealing, as defined in the Copyright Act 1968) without the express written permission of Earlam & Partners Ltd. Contravention is an infrigement of Copyright Act and its amendments and may be subject to legal action.
The risk of loss associated with futures and options trading can be substantial. Opinions set forth herein should not be viewed as an offer or solicitation to buy, sell or otherwise trade futures, options or securities. All opinions and information contained in this email constitute EAP’s judgment as of the date of this document and are subject to change without notice. EAP and their respective directors and employees may effect or have effected a transaction for their own account in the investments referred to in the material contained herein before or after the material is published to any customer of a Group Company or may give advice to customers which may differ from or be inconsistent with the information and opinions contained herein. While the information contained herein was obtained from sources believed to be reliable, no Group Company accepts any liability whatsoever for any loss arising from any inaccuracy herein or from any use of this document or its contents. This document may not be reproduced, distributed or published in electronic, paper or other form for any purpose without the prior written consent of EAP. This email has been prepared without regard to the specific investment objectives, financial situation and needs of any particular recipient. For the customers of EAP, this email is produced exclusively for our business and expert clients, it is not for general distribution and our services are not available to private clients. Past performance is not indicative of future results.