

Cotton does nothing and volatility back in the 20's
You do not write your life with words...You write it with actions. What you think is not important. It is only important what you do!
CTK23 84.17 (+0.46)
CTN23 84.79 (+0.38)
CTZ23 84.26 (+0.51)
Zhengzhou WQK23 – 14,715 (+155)
Cotlook “A” Index – 98.40 (-1.70)
Daily volume – 22,426
AWP – 70.78
Open interest – 185,383
Certificated stock – 1,147
K23/N23 spread – (-0.62)
N23/Z23 spread – (+0.53)
May Options Expiry – 14th April 2023
May 1st Notice Day – 24th April 2023
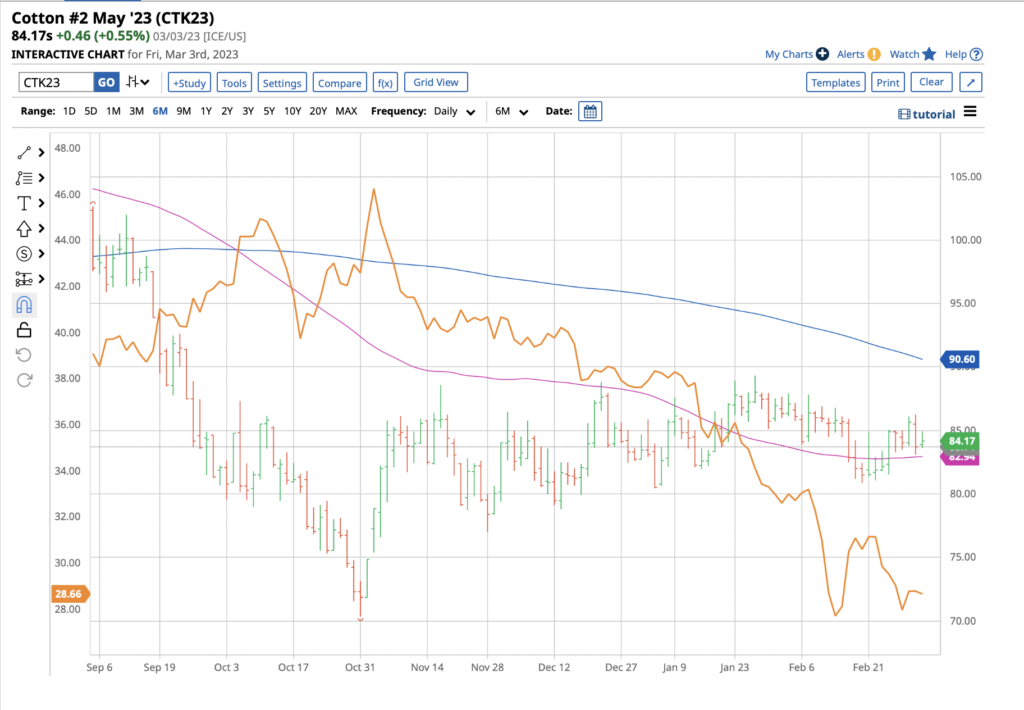
– It was a quiet week for Cotton with its entire weekly range being seen in Thursday’s trade, between 83.11 and 86.25, before closing the week down 73 points basis the front month K23!
– Average daily futures volume was a pedestrian 27,899, whilst in options it was not a whole lot better averaging 6,376 with call action slightly outnumbering puts. Unsurprisingly, volatility in the nearby K23 contract was down to 28.66% and 26.65% for the new crop Z23 contract.
– Last week’s daily average range for the nearby K23 contract was just 197 points versus 258 points the week before. This may appear a fairly meaningless point for some, but in truth it is confirmation of the fact that Cotton is going back to its normal action following nearly 2 years of extreme volatility.
– Before prices took off at the end of September of 2021, the previous 5 year daily average range for the nearby contract was 148 points. We are quite certain that we are headed to that area once again in the weeks and months ahead i.e. WE DO NOT EXPECT COTTON TO DO ANYTHING MUCH FOR THE REST OF THE SEASON!
– In options, a look at the open interest in the nearby K23 contract shows most bets at the 80 and 75 strike for puts and at the 90 and 95 strike for calls with the K23 futures price settling near the middle of this range where all the aforementioned bets would expire worthless when they expire in 41 days time on 14th April 2023. A repetition of what we said last week in this regard but certainly worthy of a mention again!
– The chart of K23 is included below for which we have the following comments! Note how the volatility has dropped, denoted by the orange line with the scale on the left. Secondly, the blue 200 day (92.64) and purple 100 day (82.94) moving averages are starting to converge. We are of the opinion that as, when and if the 100 day crosses the 200 day, it will highlight a bullish signal for the market which should probably not be ignored! However, this will most likely not occur until later in the year (probably May or June) which regular readers of these reports will know is statistically the most probable time to see seasonal lows. In this instance we are of the opinion this is not going to happen this season but in new crop Z23 which we believe will be a non inverse season where lows occur early in the season and highs later.
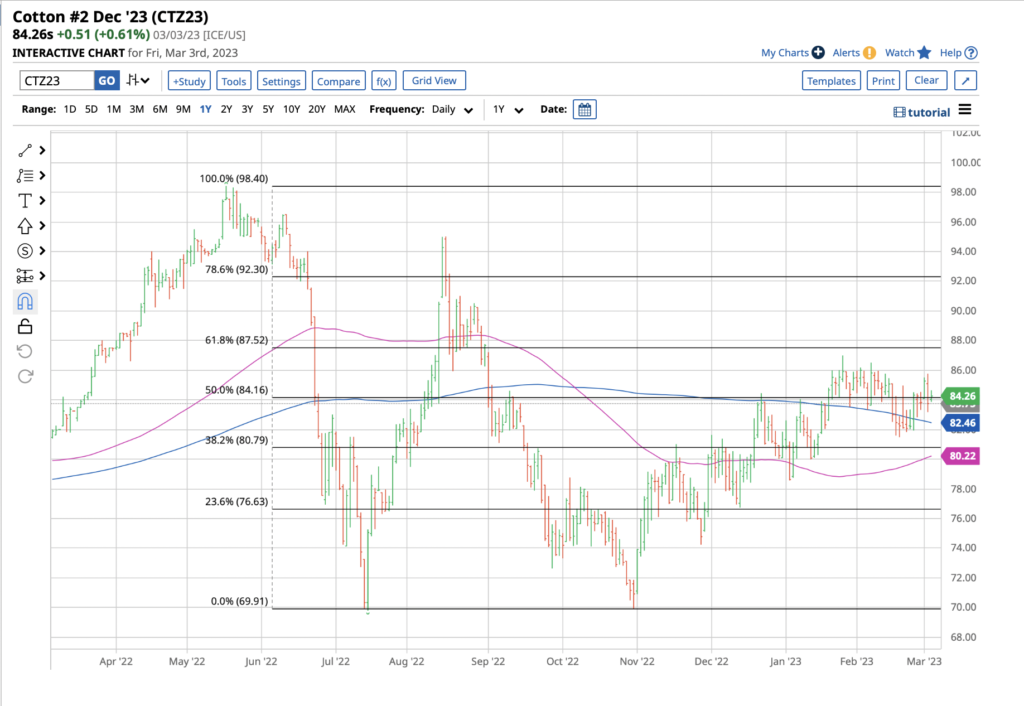
– The chart of Z23 is also included below and one can see that so far this contract has traded in a range of approximately 28c/lb between approximately 70 and 98c/lb but closing right in the middle of this range on Friday. This contract averages about a 30c/lb move each calendar year this century!
– Some pundits have been claiming how cheap this contract is but we are certainly not one of them. In truth we consider it neither cheap or expensive noting there are nearly 8 months to go until its expiry and the stats back us up.
– The average price of Z over the 23 years of available data this century is 72.26 with an average high of 87.29 and low of 57.24. The average number of days between highs and lows during a season is about 7 months since 1960, so with 8 months to go until the expiry of Z23, it is perhaps a little early to be getting too friendly to new crop especially when the USDA is still overstating world consumption by circa 7mb! next week will see the March WASDE and we doubt they will do much to address this point!
– The CFTC COT report as of 7th February is still 3 weeks behind schedule, but shows that between Managed Money (MM), (Other and Non Reportables (OR and NR) they still hold a small net long position of 11,959 contracts. The one single factor that could spell a buliish move for Cotton is the fact that funds have massive ammunition to drive prices higher but they need a reason to buy it and that is simply not there at the present time!
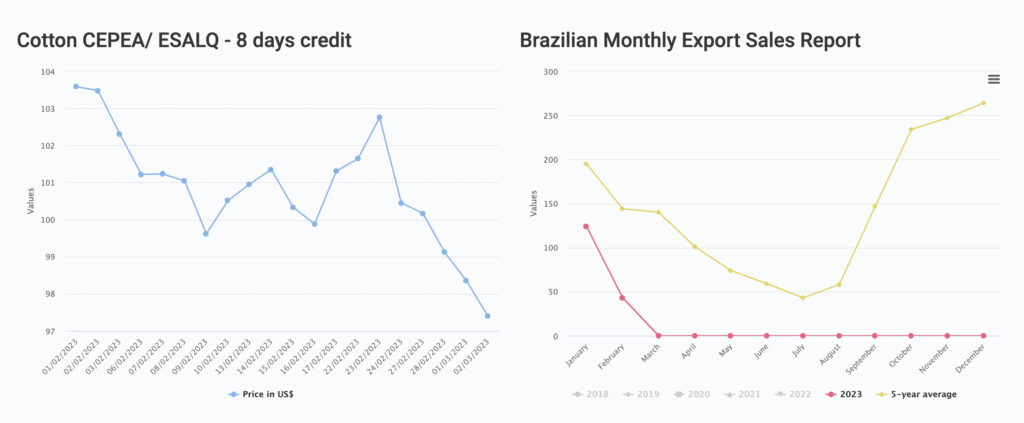
– In Brazil, domestic prices have fallen 10% this week as you can see in the graph below. MDIC reported Brazilian export sales of 43,000 tonnes for the month of February 2023. This figure is 63% behind February 2022 and 70% behind the 5-year average of 143,871 tonnes.
– Low mic and variable quality issues in China last year for Brazilian have certainly hampered sales there this season!
We believe value is to be had in the low 80’s basis K23 and EAP would be a scale down buyer of Cotton from this level down to the long standing gap in the mid 70’s dating back to November, were prices to reach there. Above, we maintain that prices in the high 80’s has Cotton fully valued, with any move in to the 90’s to be considered a selling opportunity. We maintain that an anticipated relatively wide trading range of 75 to 95c/lb is likely to prevail to the end of the season ending May 31st.
*Please note that we only share CFTC CTO on weekend reports.

No image or information display on this site may be reproduced, transmitted or copied (other than for the purposes of fair dealing, as defined in the Copyright Act 1968) without the express written permission of Earlam & Partners Ltd. Contravention is an infrigement of Copyright Act and its amendments and may be subject to legal action.
The risk of loss associated with futures and options trading can be substantial. Opinions set forth herein should not be viewed as an offer or solicitation to buy, sell or otherwise trade futures, options or securities. All opinions and information contained in this email constitute EAP’s judgment as of the date of this document and are subject to change without notice. EAP and their respective directors and employees may effect or have effected a transaction for their own account in the investments referred to in the material contained herein before or after the material is published to any customer of a Group Company or may give advice to customers which may differ from or be inconsistent with the information and opinions contained herein. While the information contained herein was obtained from sources believed to be reliable, no Group Company accepts any liability whatsoever for any loss arising from any inaccuracy herein or from any use of this document or its contents. This document may not be reproduced, distributed or published in electronic, paper or other form for any purpose without the prior written consent of EAP. This email has been prepared without regard to the specific investment objectives, financial situation and needs of any particular recipient. For the customers of EAP, this email is produced exclusively for our business and expert clients, it is not for general distribution and our services are not available to private clients. Past performance is not indicative of future results.