

July Cotton drops 12c/lb off its recent life of contract high in 2 days!
People will forget what you said, people will forget what you did, but people will never forget how you made them feel
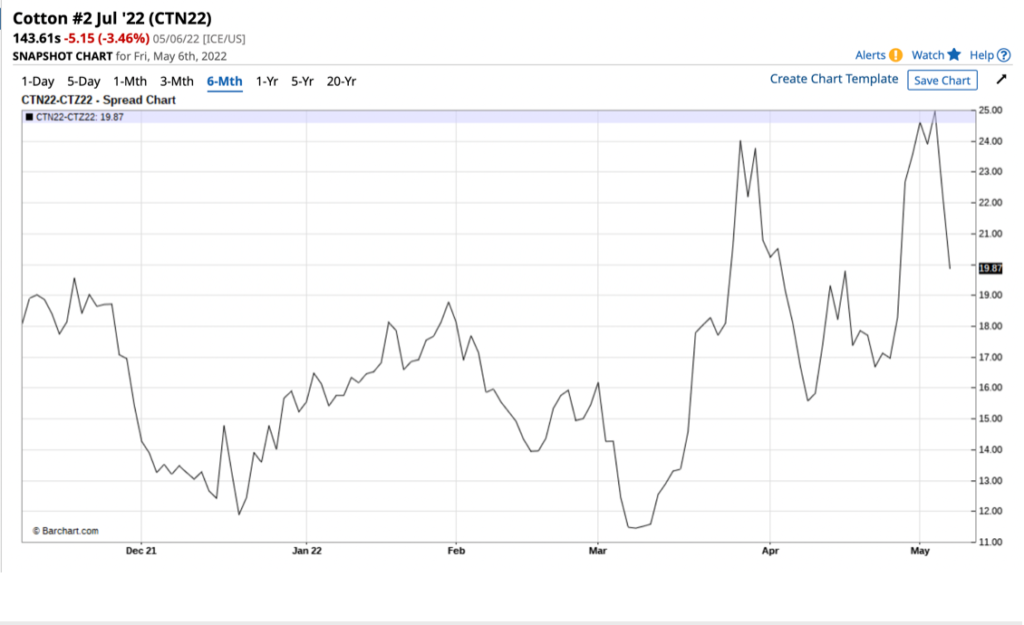
CTN22 143.61 (-5.15)
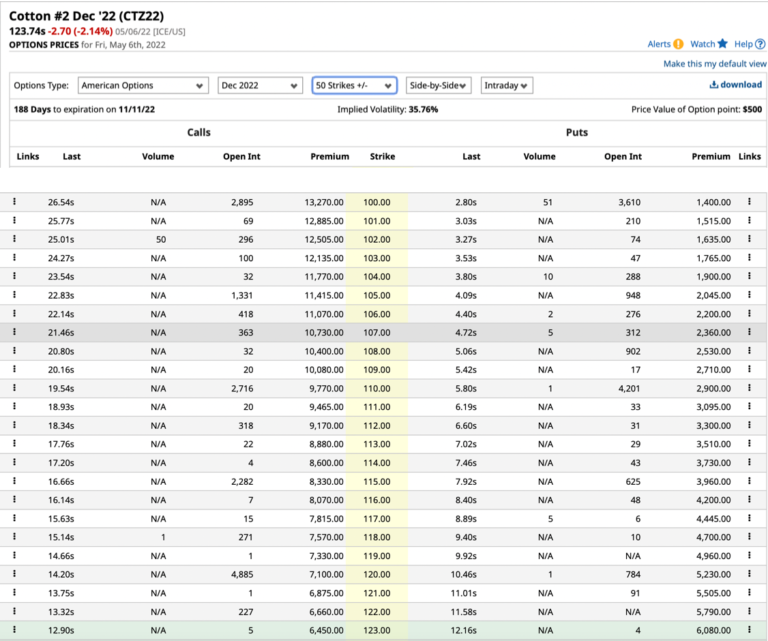
CTZ22 123.74 (-2.70)
CTH22 118.34 (-2.32)
Zhengzhou CF209 – 21,490 (-440)
Cotlook “A” Index – 167.45 (-6.00)
Daily volume – 31,192
AWP – 136.20
Open interest – 206,155
Certificated stock – 1,101
July / Dec spread – (+19.87)
July Options Expiry – 10th June 2022
July 1st Notice Day – 24th June 2022
September Options Expiry – 19th August 2022
December Options Expiry – 11th November 2022
December 1st Notice Day – 23rd November 2022
– Both old crop N22 and new crop Z22 finished the week on the defensive following a new spike high, in what proved to be another highly volatile week for the Cotton market! Volume remained similar to the previous week at 28,503 futures daily. Call options traded by more than double than puts as speculative bets about how high the market can go dominate the market!
– N22 traded the week in a 1259 point range between 143.36 and 155.95 before finishing the week down 202 points at 143.61. New crop performed rather better, trading in a less volatile 841 point range between 121.50 and 129.91, before closing the week up 167 points at 123.74. The spread between old and new crop traded to a record premium of 2610 points N over Z22 on Wednesday before selling off and as portrayed by the attached chart detailed below.
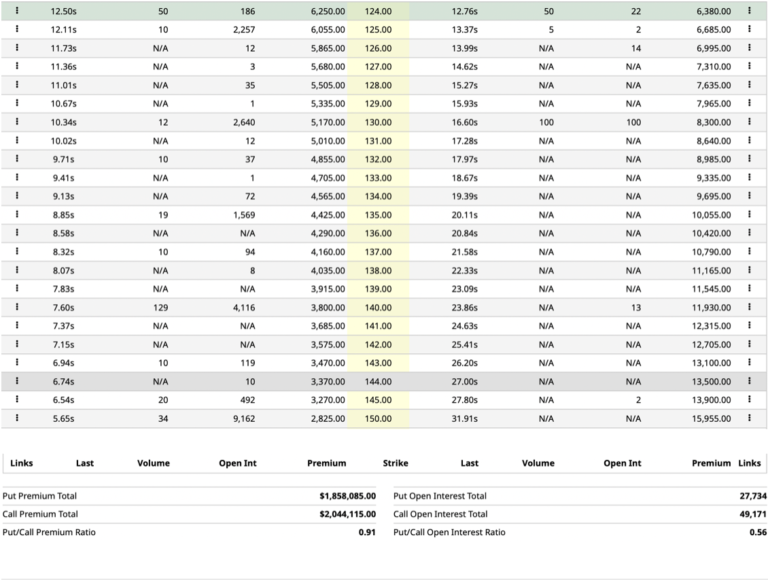
– The open interest in Z22 options shows how the 150 call costs more than double the cost of the 100 put when both options are 24 and 26c/lb out of the money respectively. The bets to the upside are simply colossal compared to those bets which are protecting a move to the downside!
– Going back to 1970 and looking at the calendar year December movements, we know that the average move over that period of just over 10 1/2 months to expiry is just under 24c/lb, yet for the last 2 years (i.e. 2021 and 2022 so far) the move is 44c/lb. This does not happen very often in the last 50+ years and the last time we saw a comparable move was this century but back in 2010 and 2011 before reverting straight back to the normal range!
– Eventually we should expect a return to normality in the years ahead but of course it does not feel like that right now. Today it is highly volatile with the daily move for Z22 averaging 486 points in the last week alone!
– In July it has never been more volatile since 2011, averaging a 651 point intraday move in the last 7 days!
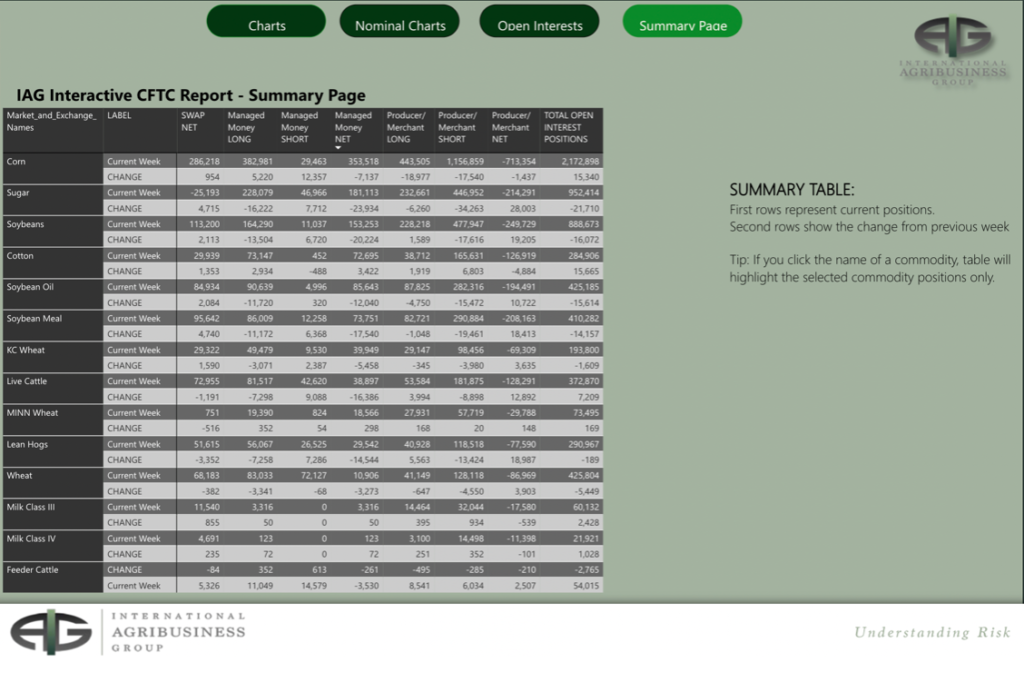
– The CFTC COT report showed that Managed Money (MM) reversed 3 weeks of selling having bought a net 3,422 contracts in the week ending last Tuesday. Between MM, OR and NR they still hold a substantial net long of 96,980 contracts.
– The chart below shows how MM funds remain long of most commodities and thanks to our friends at IAG for pictorial evidence of the fact. The exodus by funds out of commodities as well as Cotton is required to end the current run. Price action next week will likely continue to be volatile!
– Following the comments made in yesterday’s report about the comparison of NY and the CZCE prices noting NY appears over valued we thought it would be interesting to share some rather insightful findings on the timing of the recent life of contract high seen in the July contract.
– The bull run began back on the 1st April 2020 and there have been an exact Fibonacci 764 days that coincided with the high of 155.95 seen on Wednesday before seeing a sustained sell off that is the strongest downward move seen since this bull market began.
– Moreover, we have still not managed to have a weekly close above the 1.618 retrace of the century low of 28.20 to the all time high of 227.00 lying at 151.06 pointed out in last weekend’s report.
– We also know that May is statistically the most likely month for a seasonal high occurring a staggering 28% of the time since 1960 with the season covering June 1st to end May 31st thereby incorporating months of the same crop year i.e. Z, H, K and N.
– One of the reasons we are on high alert for a seasonal high in Z22 too is because of the massive run Z22 has been on for weeks and because in 2011 the high was on the 2nd June in the midst of an almost identical Texas drought to the one we are facing today! On that occasion the market fell 33% over a 6 week period from 140 to 95c/lb! The equivalent fall would be like Z22 going to 86c/lb from its high just below 130c/lb. We do not expect this scale of fall but if the funds start selling out of Corn, Soy and Cotton a swift move to 100c/lb would not be out of the question for Z22!
The sell off continued following Thursday’s limit down move and price action next week will need to be monitored very closely to see if this bull has finally ended or we are merely pausing for breath? Involvement in N22 is something to avoid if possible, but for new crop December we maintain this contract is very fully valued above 125c/lb and the recent spike in N22 offered a golden opportunity to lock in a good proportion of new crop sales 25c/lb higher than one could get just 6 weeks ago.
*Please note that we only share CFTC CTO on weekend reports.

No image or information display on this site may be reproduced, transmitted or copied (other than for the purposes of fair dealing, as defined in the Copyright Act 1968) without the express written permission of Earlam & Partners Ltd. Contravention is an infrigement of Copyright Act and its amendments and may be subject to legal action.
The risk of loss associated with futures and options trading can be substantial. Opinions set forth herein should not be viewed as an offer or solicitation to buy, sell or otherwise trade futures, options or securities. All opinions and information contained in this email constitute EAP’s judgment as of the date of this document and are subject to change without notice. EAP and their respective directors and employees may effect or have effected a transaction for their own account in the investments referred to in the material contained herein before or after the material is published to any customer of a Group Company or may give advice to customers which may differ from or be inconsistent with the information and opinions contained herein. While the information contained herein was obtained from sources believed to be reliable, no Group Company accepts any liability whatsoever for any loss arising from any inaccuracy herein or from any use of this document or its contents. This document may not be reproduced, distributed or published in electronic, paper or other form for any purpose without the prior written consent of EAP. This email has been prepared without regard to the specific investment objectives, financial situation and needs of any particular recipient. For the customers of EAP, this email is produced exclusively for our business and expert clients, it is not for general distribution and our services are not available to private clients. Past performance is not indicative of future results.