

- Harry Bennett
- January 16, 2023
- 4:44 pm
- 10 min read
Corn rallies as the USDA reports smaller corn and Soy harvests along with a reduction in overall supplies!
Indices
Futures
Forex
– March Corn’23 (ZCH23) – Corn recovers after the sell off at the start of the year. The market is still locked within the upper and lower trendlines which have been drawn on the chart above. The market will still need to overcome 685.00 as the prior swing high and major level of resistance. However, resistance will be seen at current levels.
– Support will be found at 38.2% Fibonnacci Retracement located around the 652.10 and 648.00 handle.

– The USDA WASDE report brought some surprise last week, corn jumped upon release of figures with trading for the week taking place within a 26.40 cent range between 648.20 and 674.60. Now the question remains as to whether the market can break through prior swing highs with a decisive move to the upside. Trading volume was up from last week with 302,700 contracts traded daily.
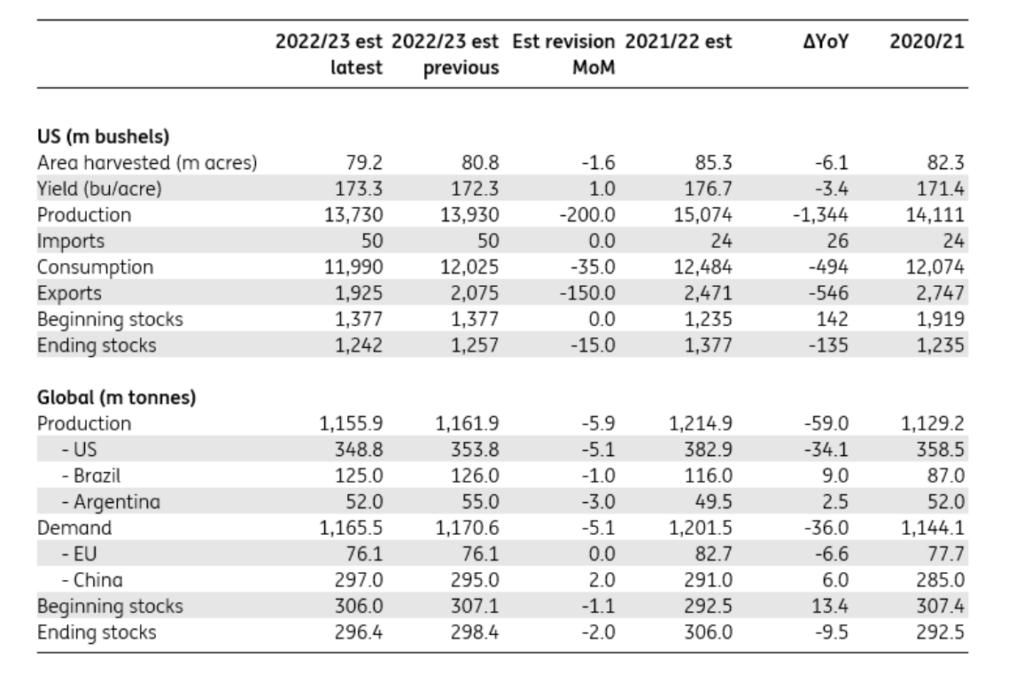
– The USDA WASDE report revealed smaller harvests for both U.S. corn and Soybeans. The crop production estimates came in at 13.730 and 4.276 billion bushels respectively. For corn, yields were higher than expected at 173.3 bushels per acre. This was largely the result of better yields with new records set in Illinois & Minnesota. The former being one of the largest producing corn states.
– The main reason for a fall in production which bolstered strength on the futures market was the reduction in harvested area. At 79.2 million acres, this was sharply below 2021/22 at 85.318 million and trade estimates at 80.763.

– On the global corn balance sheet we also saw some marginal tightening with 22/23 ending stocks lowered from 298.4 million mt to 296.4 mmt. This was the result of lower global production estimates and lower beginning stocks (Table below).
– The weekly CFTC commitment of traders report revealed a very bearish sentiment from the hedge funds (managed money = MM). As of 10th January 2023, the MM had closed 31,700 long contracts whilst also adding to their shorts. The result of this was a reduction in their net long position to 149,605 contracts (Link to IAG Interactive report below).
– U.S. Corn sales leading to the week ending January 5th were down 20% at 255,700mt. Mexico (223,500mt) were the leading buyer again with China 2nd at (138,600mt) with large cancellations from Unknown destinations and Honduras. The sluggish report revealed sales were down 62% from the four week average which is a concern for the market.
– Weak demand for U.S. corn remains a big problem for the market and may cap any surges on the futures markets. This is made more difficult as South America have much better crops to compete on sales and as we have exposed in previous reports, China has been buying Brazilian Corn.
– Brazil and Argentina estimates were largely unchanged in the WASDE report, despite the forecasts of light rains and dry conditions extending in Southern Brazil and Argentina. This is more of an issue for Argentina as the situation has show little improvement. We would expect reductions to the crop size in the coming WASDE reports.

– The latest update from the National Oceanic and Atmospheric Administration (NOAA) reveals a neutral El Niño-Southern Oscillation (ENSO) probability moving through Feb – April’2023 but El Niño (definitions below) comes starts to gain traction moving into July – September 2023 period. The data shows August – October is 50% likely to be dominated by El Nino conditions. Based on historical standards to be classified as a fully-fledged El Niño or La Niña episode, these thresholds must be exceeded for a period of at least 5 consecutive overlapping 3-month seasons.
– Official NOAA (National Oceanic and Atmospheric Administration) ENSO probabilities – January 2023 update from NOAA reveals a neutral ENSO probability moving through Feb – April’2023 but El Nino comes starts to gain traction moving into July – September. August – October is 50% likely to be dominated by El Nino conditions.
El Niño: characterised by a positive ONI greater than or equal to +0.5ºC.
La Niña: characterised by a negative ONI less than or equal to -0.5ºC.
By historical standards, to be classified as a fully-fledged El Niño or La Niña episode, these thresholds must be exceeded for a period of at least 5 consecutive overlapping 3-month seasons.

Conclusion
The recent correction found support despite the market remaining locked within the contracting triangle. However, the poor U.S. demand outlook is a major cause of concern. Despite issues with weather in South America there appears to be ample supplies globally even with a reduction in globally ending stocks. China are buying from Brazil who see large production estimates for this season. We are now heading into the Lunar New Year holiday and trading volume / funds position continues to diminish. Funds have cut their longs significantly leaving room to build a position or wait to see more from the fundamentals.
Written by:

Harry Bennett
Copyright statement
No image or information display on this site may be reproduced, transmitted or copied (other than for the purposes of fair dealing, as defined in the Copyright Act 1968) without the express written permission of Earlam & Partners Ltd. Contravention is an infrigement of Copyright Act and its amendments and may be subject to legal action.
The risk of loss associated with futures and options trading can be substantial. Opinions set forth herein should not be viewed as an offer or solicitation to buy, sell or otherwise trade futures, options or securities. All opinions and information contained in this email constitute EAP’s judgment as of the date of this document and are subject to change without notice. EAP and their respective directors and employees may effect or have effected a transaction for their own account in the investments referred to in the material contained herein before or after the material is published to any customer of a Group Company or may give advice to customers which may differ from or be inconsistent with the information and opinions contained herein. While the information contained herein was obtained from sources believed to be reliable, no Group Company accepts any liability whatsoever for any loss arising from any inaccuracy herein or from any use of this document or its contents. This document may not be reproduced, distributed or published in electronic, paper or other form for any purpose without the prior written consent of EAP. This email has been prepared without regard to the specific investment objectives, financial situation and needs of any particular recipient. For the customers of EAP, this email is produced exclusively for our business and expert clients, it is not for general distribution and our services are not available to private clients. Past performance is not indicative of future results.