

CTZ22 103.29 (+0.58)
CTH23 100.15 (+0.57)
CTK23 97.88 (+0.45)
Zhengzhou CF301 – 14,710 (+295)
Cotlook “A” Index – 120.85 (-3.40) – 14th September
Daily volume – 16,344
AWP – 94.92
Open interest – 209,306
Certificated stock – 4,552
Z22 / H23 spread – (+3.14)
Z22 / Z23 spread – (+20.43)
December Options Expiry – 11th November 2022
December 1st Notice Day – 23rd November 2022
Introduction
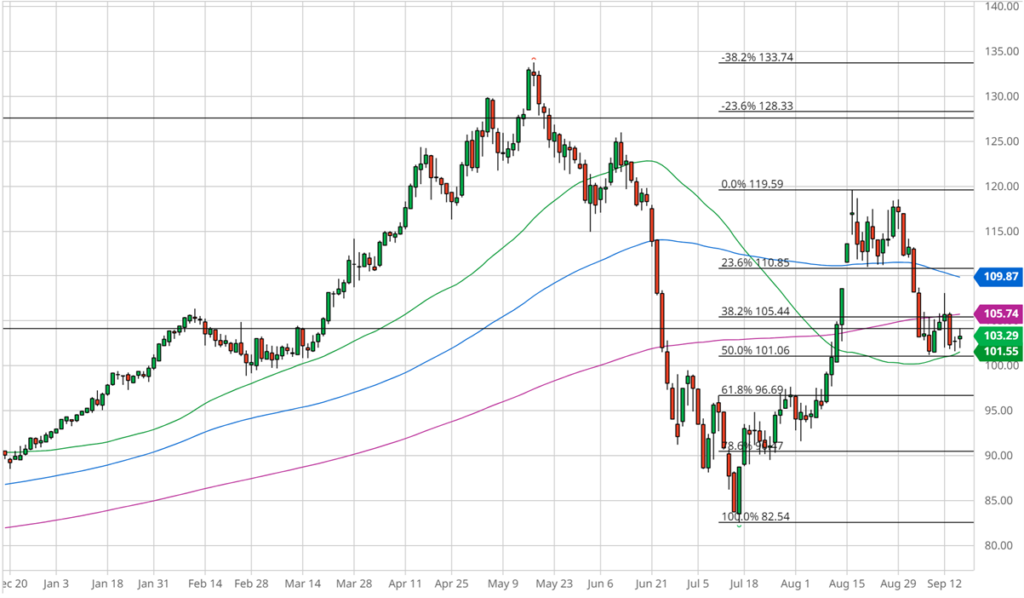
• A short-lived attempt by the market to build some momentum was reversed on Monday following a bearish USDA WASDE report (see below). So far, the near term bottom (101.19) has held, with yesterday’s low reaching 101.61. The market had a brief attempt to rally today, but ran out of steam somewhat, eventually closing at 103.29 basis the Dec ’22 contract, up 58 pts.
• Annualized US inflation figures for August came in at 8.3% early in the week. Whilst this was below July’s figure of 8.5%, it was above market expectations of 8.1% and led to fears that the Fed will raise rates by a full percentage point later this month rather than the anticipated 0.75. Following the news stock markets had their largest daily fall since the beginning of the pandemic.
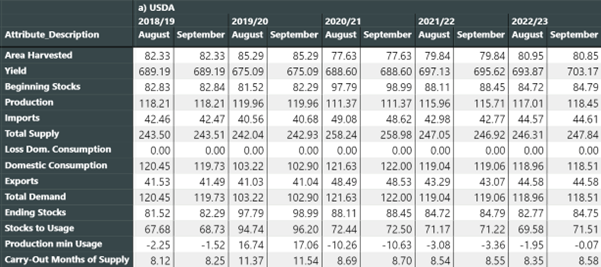
• The USDA released the August WASDE on Monday, giving the market whiplash in the process. After last month’s 3 million bale cut to the US crop this month’s report increased it by 1.262 million bales to 13.832 million bales. In a stroke the USDA have gone from the very low end of US production estimates to the very high end. Whilst we accept that revised acreage estimates were the driver there seems to be a complete lack of joined up thinking behind the approach. In particular given that a willingness to be bold on US production estimates is married to an agonising caution in addressing inaccuracies in both global consumption and historical stocks in China and India.
• “Aha,” you may say, “the USDA did adjust consumption this month!” Look a bit closer though and it is just as baffling as their erratic changes to US production. The most notable changes to “mainstream” consuming markets were: Pakistan, where 21/22 consumption was cut 100k bales and 22/23 by 400k bales and Vietnam, where 21/22 and 22/23 were cut by 100k bales each.
• Outside of these changes consumption adjustments were dominated by some, frankly bizarre, historical adjustments to Uzbek consumption. The below table compares the changes made for both global and Uzbek consumption:
Global Uzbekistan
2018/19 -725 -750
2019/20 -315 -340
2020/21 370 290
2021/22 244 390
2022/23 -460 50
• To put this in context, USDA’s 2018/19 consumption estimate for Uzbekistan now stands at 1.95 million bales. In other words, the USDA seem to have just realised that their Uzbek consumption number, going back five seasons, was almost 30% too high. Riddle me that………
• In short, the USDA still have some significant issues in their consumption numbers in the chief consuming markets. Following our own recent reviews EAP now estimate global consumption for 22/23 to be more than 5 million bales below the USDA.
• The USDA today released three catch up export sales reports covering a month’s worth of data. For the whole period net upland sales for 2022/23 totalled 589,100 bales, or an average of 147,275 bales a week. Flood hit Pakistan accounted for 241,600 bales, or 41% of the total over the period. For the next marketing year sales for the period totalled 219,500 bales (54,875 bales a week on average) with Pakistan this time taking 104,500 bales or 48% of the total. Exports totalled a healthy 947,100 bales for the period.
• Looking only at the most recent week, ending 8th September, total net sales were 100,300 bales for this marketing year and 25,500 bales for the next. Pakistan bought, respectively, 77,900 and 21,700 bales. Exports for the week totalled 141,000 bales.
• CFTC cotton on call report based positions for the week ending 9th September showed a small overall reduction in the net on call sales position of 1,060 contracts for the current crop as the Dec position was reduced by 2,179 contracts and the forward months increased by 1,119 contracts. The overall current crop position stands at 68,251 contracts and is the 5th highest for this time of the year, over half of this position, 34,636 contracts, is in the Dec and is the largest ever position for this week of the year.
Conclusion
EAP believe that any rallies in the Cotton market, up to the 200 day moving average at 105.74 should be sold. We would be surprised to see Z22 reach the 120’s again this season and longer term, EAP remain of the belief that the 22/23 season will prove to be an inverted one, with the final low at the end of the season and scale up selling into any strength over the coming days will likely prove to be prudent.
Useful links
*Please note that we only share CFTC CTO on weekend reports.
Written by:

Jo Earlam
Copyright statement
No image or information display on this site may be reproduced, transmitted or copied (other than for the purposes of fair dealing, as defined in the Copyright Act 1968) without the express written permission of Earlam & Partners Ltd. Contravention is an infrigement of Copyright Act and its amendments and may be subject to legal action.
Disclaimer
The risk of loss associated with futures and options trading can be substantial. Opinions set forth herein should not be viewed as an offer or solicitation to buy, sell or otherwise trade futures, options or securities. All opinions and information contained in this email constitute EAP’s judgment as of the date of this document and are subject to change without notice. EAP and their respective directors and employees may effect or have effected a transaction for their own account in the investments referred to in the material contained herein before or after the material is published to any customer of a Group Company or may give advice to customers which may differ from or be inconsistent with the information and opinions contained herein. While the information contained herein was obtained from sources believed to be reliable, no Group Company accepts any liability whatsoever for any loss arising from any inaccuracy herein or from any use of this document or its contents. This document may not be reproduced, distributed or published in electronic, paper or other form for any purpose without the prior written consent of EAP. This email has been prepared without regard to the specific investment objectives, financial situation and needs of any particular recipient. For the customers of EAP, this email is produced exclusively for our business and expert clients, it is not for general distribution and our services are not available to private clients. Past performance is not indicative of future results.