Front Month CTZ23
Let’s have a closer look into Dec’23 cover month
Conclusion of latest market report:
N23 has been trading between 76.25 and 89.59, being a range of 13.34c/lb for over 7 months. Last week, we questioned whether the market could retest recent lows, only to see a subsequent strong rebound. Nevertheless N23 remains within it’s nearby range of 79.52 to 87.52. The one certainty in our mind is that this contract month will see continued volatility within this range and and perhaps even the wider range of the highs of 89.59 and chart gap down to 74.85. There are likely to still be some wild moves into expiry of the N23 contract and trading this month should be avoided if at all possible! New crop Z23 has been less volatile, trading between 74.25 and 86.98, being a 1273 point range over the same period. EAP suggest this contract is fully valued in the mid to high 80’s and maintain that end users should only consider a scale down long and/or “on call” fixations from the mid 70’s, to maybe into the 60’s at some point!
Link to latest market report:
CTZ23 Chart
CTN23/ CTZ23 Spread
CFTC Cotton On Call (K, N only)
CFTC - Commitment of Traders
CTN23/CTZ23 Spread
CTZ23/CTZ24 Spread
Managed Money
Suggested study
In this study, we are comparing the progress of implied volatility of current season against 2011/12 season.
Historical CTZ23
Let’s have a look at historical data for the March cover month, looking from start of November until end of January. This is the period where open interest is highest in March, therefore it is the front month.
72.21 c/lb
Average price of CTZ for the past 23 years, looking from January until the end of October.
May
In the past 50 years of data, highs in CTZ have occurred 8 times in May.
January
We have also seen CTZ hit its lowest price 12 times in the month of January since 1970.
Average price of CTZ for the past 50 years
Average price of Cotton per decade
Cotton's Big Brothers
Weekly reports on performance of Soybeans & Corn
Conclusion of latest report
the weather premium for U.S. market is firmly in place as yields may be reduced further due to persisting droughts. We may see more downgrades and reductions in both the U.S., China and Europe if the adverse weather continues. The funds have really axed their long position which could be the catalyst to move this market lower. The extension of the Black Sea grain initiative is not supporting the bulls as export flows look to be sturdy. A decisive move above key resistance levels and contracting triangle is needed to bolster this bullish tone.
Analysis

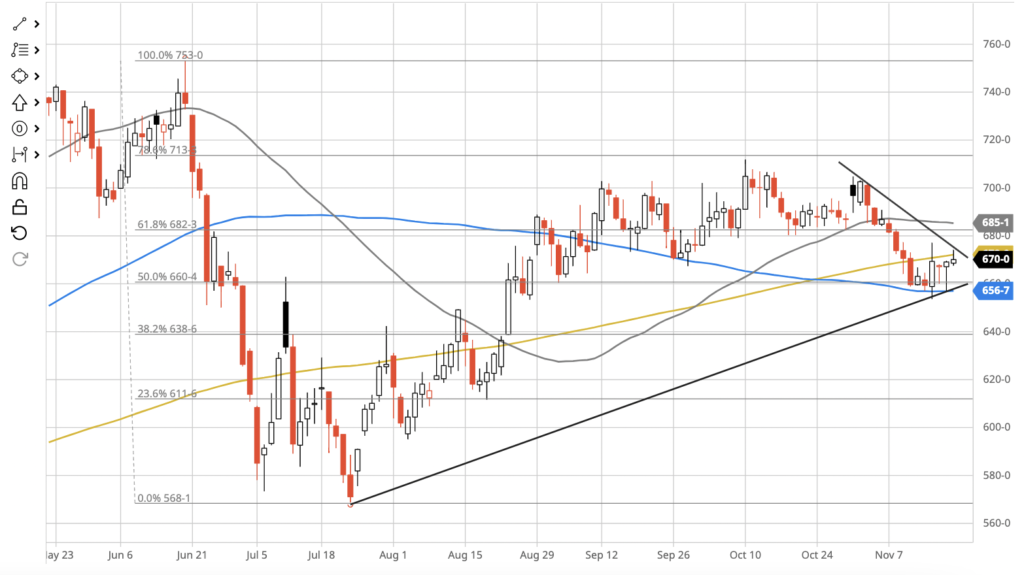
The January contract traded in a range of 58 and closed the week down 21.6 cents. As expected the market encountered overhead resistance from that downward trend line and broke through the 200 day MA and 50% retrace level. It continued to the downside on Thursday before bouncing off the 38.2% retrace. Going forward we see see the formation of the contracting triangle leading to a decisive move in the next week or so and we expect it to be to the downside with support seen at the 23.6% retrace level seen on the chart above.
Conclusion of latest report
the weather premium for U.S. market is firmly in place as yields may be reduced further due to persisting droughts. We may see more downgrades and reductions in both the U.S., China and Europe if the adverse weather continues. The funds have really axed their long position which could be the catalyst to move this market lower. The extension of the Black Sea grain initiative is not supporting the bulls as export flows look to be sturdy. A decisive move above key resistance levels and contracting triangle is needed to bolster this bullish tone.
Analysis

March Corn’22 (ZCH23) – March Corn futures find support at the 50 day moving average around 566.00 basis ZCH23. The effective front month traded within a 23.60 cent range between 653.40 and 677.00. A narrow trading range as the market bounces between the 50 % 61.8% Fibonacci retracement levels (660.40 and 682.30 respectively).
Brazil News
Domestic prices, weekly news and special reports about the world’s second largest exporter of Cotton
- Business is starting to pick up after the holiday periods, however, we are still feeling the demand a little weak and, on the other hand, the price ideas between buyers and sellers appear a little distant. We are seeing some spot business mainly for the domestic market and for the export market mainly for the crop 23/24. Due to the beginning of the crop and the higher cotton availability, the pace of trade is expected to increase.
- 92,3% of 2022/23 crop has been planted. According to Conab, this is an 5,1% decrease compared to the same period last year.
- In Mato Grosso, the last couple of days have been favourable for crop cultivation. The delay of 20% in planting, compared to same period last year, has improved over the past two weeks and Mato Grosso now is 8,8% behind schedule. This is not a concern considering the high operational capacity of Brazilian farmers.
